Insights Dashboard
The Insights Dashboard provides insight into the quality of customers your organization acquires, based on the number and percentage of authorizations by card type or other indicator, and contrasts that with the number of customers whose authorizations are successfully converted to deposits. There are four categories of indicators: Affluence, Prepaid, Corporate Customers, and Country of Issuing Bank.
Using these values and the related charts, your organization can decide whether the customer mix you are attracting is maximized for revenue potential, or if a change in marketing is required. By using the adjustable date range and reporting groups, you can compare the quality of customers between different business units and affiliates, or monitor the response to marketing campaigns.
The Insights Dashboard is only seen if your users have the appropriate permissions to View Customer Insights.
The Insights Dashboard requires a browser/device that supports Adobe Flash. To view a beta version of a non-Flash report, click ‘Try Beta Version.’ near the top left of the page.
To access the Insights Dashboard:
-
From the iQ Bar, click the Insights icon and chose Insights from the list of available reports, or from the Insights Navigation bar. The Insights Dashboard appears.
-
Specify the desired Date Range. The default date range is 60 days (assuming there is 60 days of data available), ending on yesterday’s date.
-
Specify the desired Reporting Group and Currency, and click View to refresh the display.
See Notes on Reporting Group Limits for information on the report groups shown in the Reporting Group drop-down selector.
-
To change the perspective of the Insights Dashboard, select the desired view in the Select a Report list. Your choices are:
-
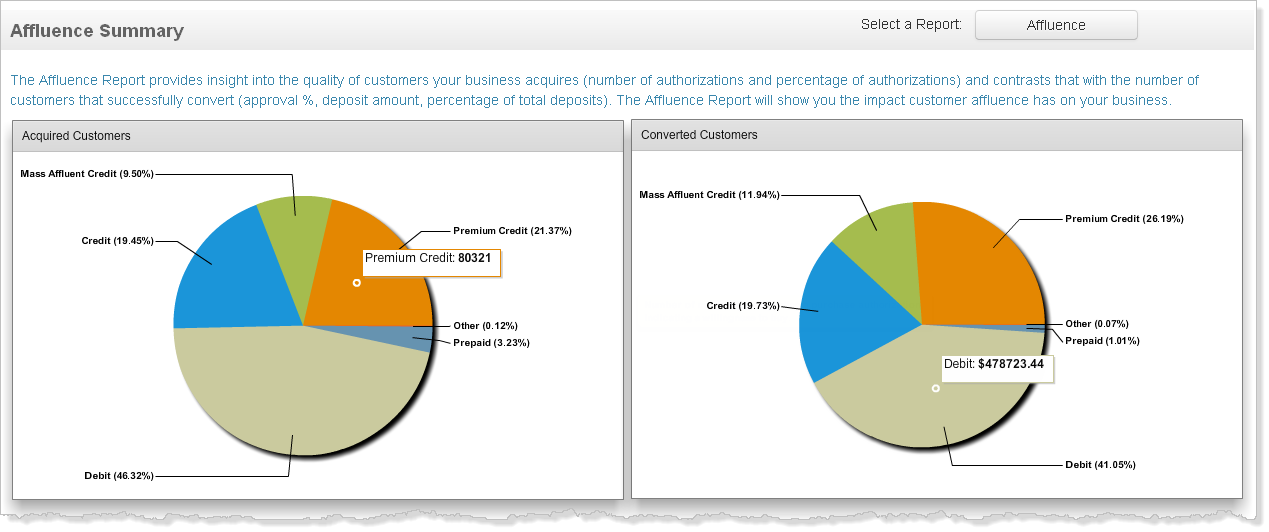
Insights - Affluence: an analysis of Premium and Mass Affluent customers in proportion to other payment segments.
-
Insights - Prepaid: an analysis of the impact of reloadability on prepaid card approval and revenue.
-
Insights - Corporate Customer: an analysis of corporate customers in proportion to consumer cardholders.
-
Insights - Country of Issuing Bank: an analysis of the proportion of customers from the top six countries, based on the nationality of the payment card.
-
Insights Dashboard Showing Affluence Report

Insights Dashboard Features
Each of the Insights Dashboard views comprises the following panels:
-
Summary Charts depicting the data in the detail tables including:
-
The total number and percentage of all attempted purchase authorizations (acquired customers), segmented by card type or other indicator.
-
The total dollar value and percentage of all successful deposits (converted customers), segmented by card type or other indicator.
You can view the counts associated with the percentage amounts in each chart by positioning your pointer over a chart segment, as shown in the figure below.
-
-
Detail Tables that provide the tabular data used to generate the charts, along with other relevant data, such as the number and percentage of approved authorizations.
In addition, Field-Level Help is available when you position your pointer over most areas and fields of each report. Use the Field-Level Help toggle control ( ) on the upper right side of the dashboard to turn the field-level help on or off.
Affluence Summary Charts showing Data Tips