Insights - Corporate Customer
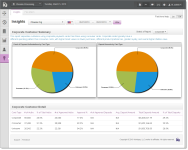
The Corporate Customer Report view of Insights Dashboard separates customers using corporate payment cards from those using consumer cards. Corporate cards typically have a different spending pattern than consumer cards, with high ticket values on fewer purchases, different product preferences, greater loyalty, and overall higher lifetime value. The data and charts in the report are segmented by corporate, consumer, and unknown card types.
Corporate Customer Report
The table below describes each of fields in the Corporate Customer Detail table.
|
Field |
Description |
|
Card Type |
The category of cardholder (Corporate, Consumer, and Unknown). |
|
# of Auths |
The total number of authorization attempts for each card type for the designated reporting group and time period. These counts are shown in the Acquired Customers pie chart when you hover over a payment card type. |
|
% of Total Auths |
The share of authorization attempts segmented by card type as a percentage of the total authorizations attempted. These percentages are represented in the Acquired Customers pie chart. |
|
# of Approved Auths |
The total number of approved authorizations for each card type for the designated reporting group and time period. |
|
Approval % |
The share of authorization approvals that occurred for each card type as a percentage of the total authorizations approved. |
|
# of Approved Deposits |
The total number of individual deposits resulting from successful payment authorizations. |
|
Avg. Deposit Amount |
The average value of successfully authorized transactions. This is the best metric for comparing the value of a segment to your business. |
|
Total Deposits Amount |
The total deposit amount for each card type for the designated reporting group and time period. These counts are shown in the Converted Customers pie chart when you hover over a payment card type. |
|
% of Total Deposits |
The deposit amount for each card type as a percentage of the total deposits. These percentages are represented in the Converted Customers pie chart. |
