Trending Dashboard
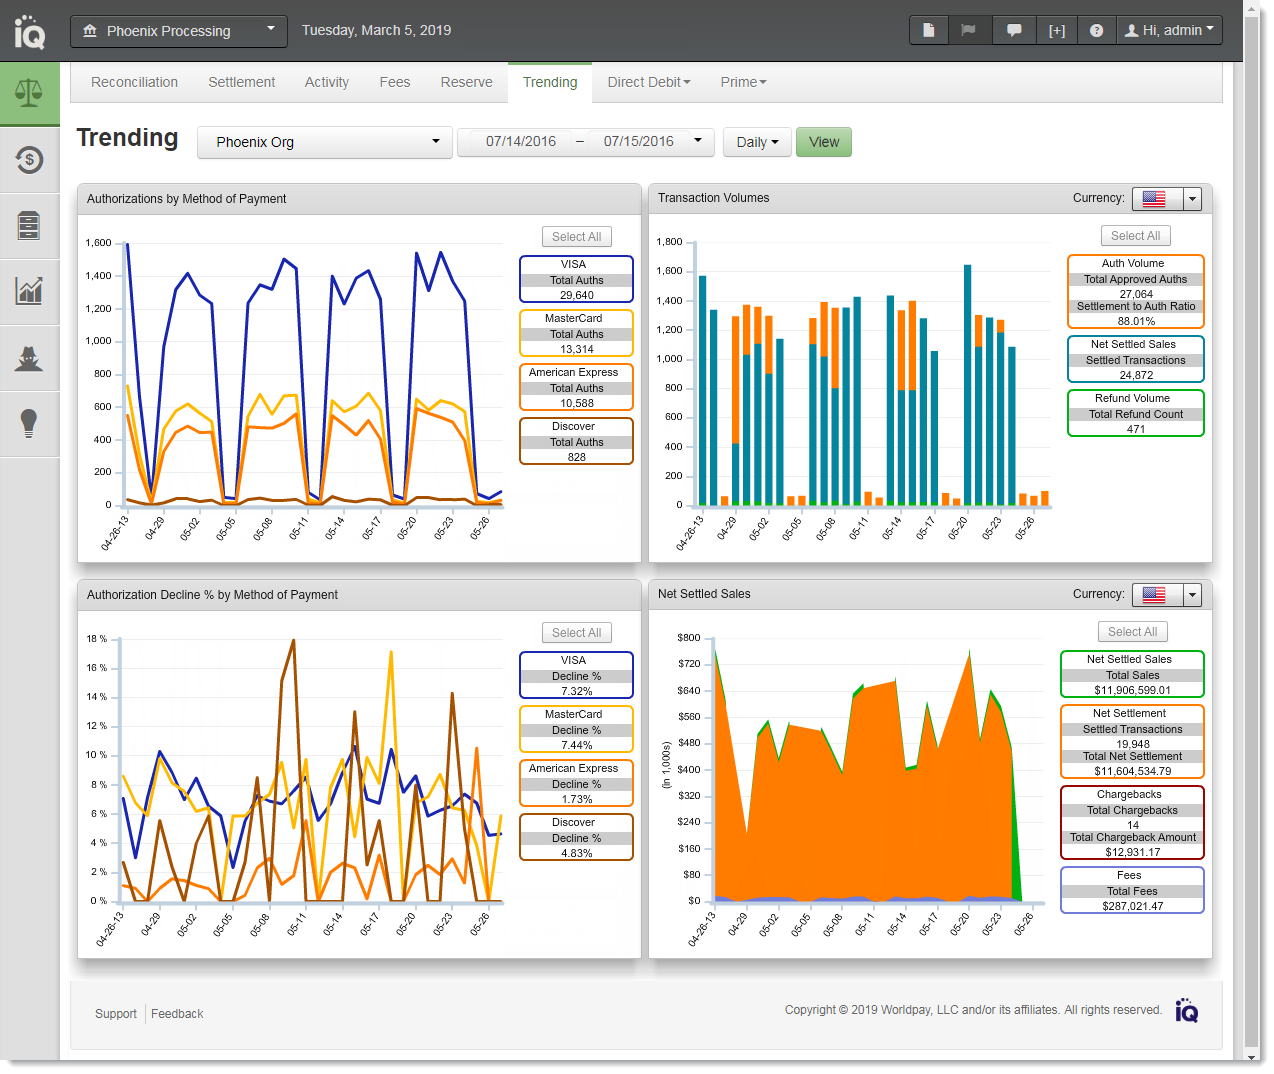
The Trending Analytics Dashboard conveys authorization-related data including volume rates, decline rates, and settlement-to-authorization ratios. The Trending Dashboard displays four charts on a single page that convey authorization-related data for a specified date range and reporting group. A sample Trending Dashboard is shown below.
For more general information on Analytics Dashboards, see Navigating the Analytics Dashboards.
Trending Analytics Dashboard
To access the Trending Dashboard:
-
From the iQ Bar, click the Financial icon and select Trending from the list of available reports, or from the Financial Navigation bar. The Trending Dashboard appears.
-
Specify the desired Date Range (the default date range is 30 days).
-
Select a Granularity Level (Daily, Weekly, Monthly, or Yearly) that is appropriate for your date range. For example, you cannot select a yearly rollup if the date range specified is two weeks. The default rollup is Daily. Click View to refresh the display.
-
To change the focus of the report to a different Reporting Group, select the desired group and click View to refresh the display.
The Trending Dashboard displays the following charts:
In some charts, the elements displayed in the legend depend on the data available for a given time period. For example, in the Authorizations by Method of Payment Type chart, only those payment types (Visa, Mastercard, American Express, PayPal, etc.) where authorizations are present are displayed as part of the legend and the chart.
The sections that follow describe each of the charts displayed in the Trending Dashboard.