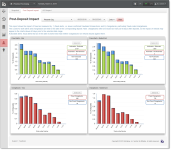
Post-Deposit Impact Dashboard
The Post-Deposit Fraud Impact Dashboard is a series of four stacked column charts showing the impact of fraud as measured by fraud alerts (issuer-confirmed fraudulent transactions) and chargebacks, particularly fraud-coded chargebacks. There are two charts for Chargebacks and Fraud Alerts--one each for Mastercard and Visa.
To access the Post-Deposit Fraud Impact Dashboard:
-
From the iQ Bar, click the Fraud icon and chose Post-Deposit Impact from the list of available reports, or from the Fraud Navigation bar. The Post-Deposit Fraud Impact appears.
-
Specify the desired Date Range (the default date range is 60 days).
-
Select a Granularity Level (Daily, Weekly, Monthly, or Yearly) that is appropriate for your date range. For example, you cannot select a yearly rollup if the date range specified is two weeks. The default rollup is Daily. Click View to refresh the display.
To change the focus of the report to a different Reporting Group, select the desired group and click View to refresh the display. (See Notes on Reporting Group Limits for information on the report groups shown in the Reporting Group drop-down selector.)
The Post-Fraud Impact Dashboard displays the following charts:
The sections that follow describe the charts displayed in the Post-Deposit Fraud Impact Dashboard.
