A-B Impact Dashboard
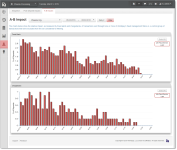
The A-B Fraud Impact Dashboard contains bar charts that show the relative impact of transactions sent through one or more of Worldpay’s Fraud Management Filters, versus a control group of transactions excluded from the transactions considered for filtering. The transactions are measured by Fraud Alerts and Chargebacks; an A-B comparison chart is shown for each. The charts show the Fraud Alerts and Chargebacks as a percentage of total deposits sent through Fraud Service Providers, over the selected time period.
The A-B Fraud Impact Dashboard allows you to compare the performance of different Fraud Prevention Service Providers, and illustrates the reduction in chargebacks and fraud alerts when transactions are filtered.
To access the A-B Fraud Impact Dashboard:
-
From the iQ Bar, click the Fraud icon and chose A-B Impact from the list of available reports, or from the Fraud Navigation bar. The A-B Impact Dashboard appears.
-
Specify the desired Date Range (the default date range is 60 days).
-
Select a Granularity Level (Daily, Weekly, Monthly, or Yearly) that is appropriate for your date range. For example, you cannot select a yearly rollup if the date range specified is two weeks. The default rollup is Weekly. Click View to refresh the display.
-
To change the focus of the report to a different Reporting Group, select the desired group and click View to refresh the display. (See Notes on Reporting Group Limits for information on the report groups shown in the Reporting Group drop-down selector.)
The A-B Fraud Impact Dashboard displays a chart for Fraud Alerts and a chart for Chargebacks.
A-B Fraud Impact Dashboard
The table below describes the data elements included in the interactive legend and the mouse-over Data Tips.
|
Element |
Description |
|
Legend Elements |
|
|
Control Group |
The total number of fraud alerts or chargebacks received for non-filtered authorizations in the control group (a group of transactions excluded from the set of transactions considered for filtering), for the date range selected, as a percentage of total deposits sent through Fraud Service providers. |
|
Worldpay Fraud Service |
The total number of fraud alerts or chargebacks received by the Fraud Service for the date range selected, as a percentage of total deposits sent through Fraud Service Providers. |
|
Data Tips |
|
|
Worldpay Fraud Service Fraud Alerts |
The total number of fraud alerts received for transactions filtered by the Fraud Service and the percentage of total deposits this represents for this date. |
|
Worldpay Fraud Service Chargebacks |
The total number of chargebacks when using the Fraud Service and the percentage of total deposits this represents for this date. |
|
Control Group Fraud Alerts |
The total number of fraud alters received for non-filtered authorizations in the control group (a group of transactions excluded from the set of transactions considered for filtering), and the percentage of total deposits this represents for this date. |
|
Control Group Chargebacks |
The total number of chargebacks received for non-filtered transactions in the control group (a group of transactions excluded from the set of transactions considered for filtering), and the percentage of total deposits this represents for this date. |
